Parcourir les catégories
Explorer
Fiverr Pro
Français
$
USD
I Turn Messy Sales Data into Dashboards and Reports That Actually Make Sense
Compétences

Voir mes services
Sales Data Analyst
Zil Money • Temps plein
Apr 2026 - Present • 6 mos
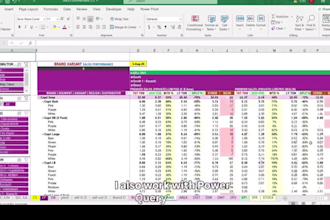
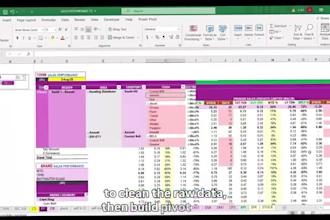
Data Analytics & Commercial Reporting – ZIL Limited I work on data analytics and commercial reporting for ZIL Limited, a Pakistani FMCG company. My core project is a multi-page commercial masterfile built in Excel, covering SKU portfolio analysis, distributor network mapping, outlet and route coverage, and trade spend analytics. On the technical side, I use Power Query (M-code) to unpivot complex, multi-header sales tonnage data into clean, analyzable formats, and build out pivot tables connected to the Data Model, using GETPIVOTDATA, SUMIFS, SUMPRODUCT, and combo charts for reporting. One piece of this work is a trade spend dashboard that compares actual trade offer percentage (TO%) against locked budget percentages, built on a large promotional dataset. I'm comfortable working with FMCG-specific commercial terminology — GSV, AP/PRI/SEC tonnage, sell-in vs. sell-out, YTD/MTD tracking, order booker structures, and distributor classifications — which lets me build reporting that speaks the language the business actually uses, not just generic dashboards.

Data Analyst
Ibex • Temps partiel
Jul 2025 - Present • 1 yr 3 mos
Worked on 15+ live client projects spanning sales performance analysis, operational reporting, and data quality management. Designed and deployed 8 interactive dashboards that replaced manual spreadsheet processes, saving stakeholders an average of 6 hours per week in reporting time. Applied regression analysis and hypothesis testing across datasets of 100,000+ records, improving decision-making accuracy by 35% for key business units. Wrote optimized SQL queries and Python scripts that reduced data extraction time by 50%, which were later adopted as part of the team's standard reporting toolkit. Maintained data integrity across all projects with less than 2% error rate on cleaned and transformed datasets.
| (2) | ||
| (0) | ||
| (0) | ||
| (0) | ||
| (0) |
iamshaqu

Allemagne
She's been very professional with her work timely delivered the project. Didn’t need revision because the data accuracy was 90%. Highly recommended!
theodore_032

États-Unis
Areesha exceeded my expectations in both quality and turnaround time. She delivered everything within 8 hours and the workbook was exactly how I wanted it. The statistical analysis and visualizations helped me understand my business performance much better. Communication was smooth throughout the project,...
Réponse du freelance
