Parcourir les catégories
Français
$
USD
Connectez votre assistant IA à Fiverr
Virtual and Executive Assistant, Operations and Data Analytics, MBA
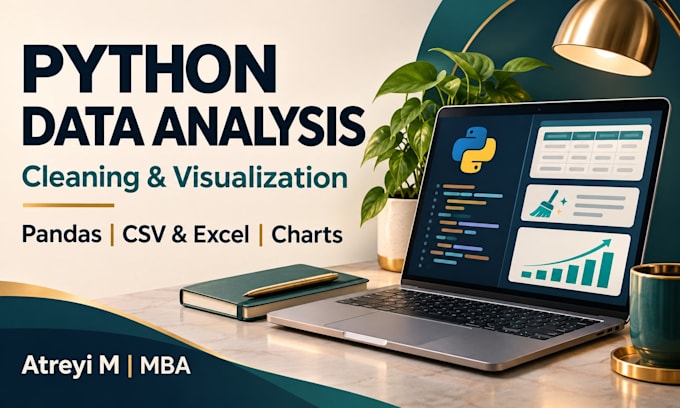
Turn messy CSV or Excel files into clean data and clear business insights.
With an MBA in Marketing and Analytics and a B.Tech in Computer Science, I combine business understanding with practical Python and Pandas skills.
I can remove duplicates, standardise dates and categories, fix data types, handle missing values using agreed rules, merge related tables and explore trends.
Basic: clean 1 table up to 10,000 rows and 20 columns.
Standard: up to 2 tables, 50,000 total rows and 30 columns per table; up to 5 charts and findings.
Premium: up to 3 tables, 100,000 total rows and 40 columns per table; up to 8 charts, an executive summary and a reusable Python script with run instructions.
All packages include cleaned CSV/Excel output, a commented Jupyter notebook and a change log. Basic includes 1 revision; Standard and Premium include 2, within the agreed scope.
Please message before ordering with a sample, your cleaning rules and business questions. Scraping, API integrations, model training and deployment need a separate scope.

Expertise:
Analyses de l'activité
•
Tendances
•
Statistiques
Technologie:
Excel
•
Jupyter Notebook
Langage de programmation:
Python
What files and data limits are included?
I work with structured CSV and Excel tables. Each worksheet counts as one table. Row limits cover all input tables combined; column limits apply per source table. Please send a sample first for large, irregular or complex joined data.
What deliverables will I receive?
Every package includes cleaned CSV/Excel data, a commented Jupyter notebook and a change log. Standard adds up to 5 charts and findings. Premium adds up to 8 charts, an executive summary, a reusable .py script and run instructions.
How do you handle missing or inconsistent data?
We agree rules for missing values, duplicates, dates and joins before cleaning. I flag uncertainty rather than invent records. I check row counts, key fields and before/after summaries, and document removals or replacements.
What is included in a revision?
Basic includes 1 revision; Standard and Premium include 2. Revisions correct or refine the agreed cleaning and analysis. New datasets, new business questions, additional charts or a changed workflow need a revised scope.
