Il semble que ce service ait été suspendu

I will design interactive dashboards and visualizations with python, matplotlib,plotly

A
ayoub_beleulmi
A
ayoub_beleulmi
Ayoub B
Certaines informations sont présentées en anglais.

À propos de ce service

Please message me before placing an order to ensure a smooth and customized experience.


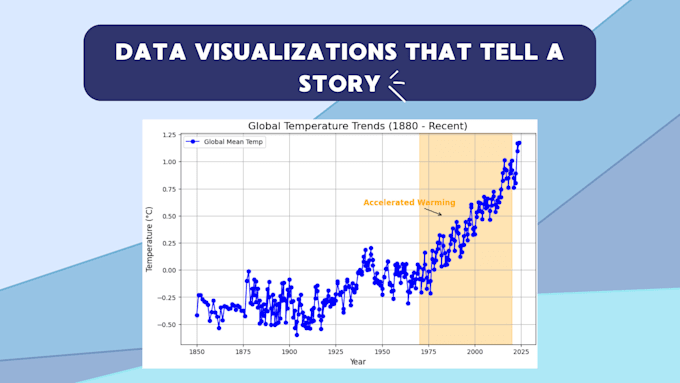
Hello, I am Ayoub, a certified Data Visualization Specialist with over 3 years of experience in data analysis, visualization, Machine learning, Generative Ai, and storytelling.


What I Offer: I will do data visualization (create plots/charts/graphs) from your data.


How It Works

  1. Provide Your Data: Share your dataset in any format (CSV, Excel, SQL, JSON, XML, etc.).
  2. Get Stunning Visualizations: I'll create customized, insightful visualizations to bring your data to life.


Types of Visualizations

  • Scatter Plots
  • Histograms
  • Box Plots
  • Heatmaps
  • Bar Charts
  • Pie Charts
  • Bubble Plots
  • Area Graphs
  • Choropleth Maps
  • Word Clouds

And more!

Tools and Technologies

  • Languages: Python
  • Libraries: Pandas, NumPy, Matplotlib, Seaborn, Plotly, Bokeh
  • Dashboard Development: Plotly-Dash, Tableau
  • Environment: Jupyter Notebooks


Why Choose Me?

  • Certified Data Visualization Expert
  • Timely delivery and tailored solutions
  • Dashboards and reports for actionable insights


Ready to turn your data into actionable insights? Lets get started!

Découvrez Ayoub B

Ayoub B

Crafting compelling data visualizations to turn raw data into impactf

  • DeAlgérie
  • Membre depuisdéc. 2024
  • Langues

    Arabe, Anglais
Experienced Data Visualization Specialist with expertise in Machine Learning and Generative AI, skilled in turning raw data into interactive and visually compelling stories. With proficiency in tools like Matplotlib, Seaborn, and Plotly, I deliver customized solutions that uncover insights, enhance decision-making, and leverage AI models for deeper analysis. Whether it's crafting dashboards, analyzing trends, or using advanced ML techniques to present data in a visually impactful way, I’m here to help you transform your data into actionable insights.

Mon portfolio