Parcourir les catégories
Explorer
Fiverr Pro
Français
$
USD


YOU SEND ME YOUR DATA I BUILD YOUR INTERACTIVE DASHBOARD
One HTML file. Double-click to open. No Power BI. No Tableau. No subscriptions. No IT support needed.
Your team drags a new CSV onto the file and the data refreshes instantly. That's it.
WHAT YOU GET
A single .html file that works offline on any Windows or Mac
KPI summary cards (totals, averages, percentages whatever your data has)
Interactive charts: bar, line, pie/donut adapted to your data
Filters by date range, category, or any column that matters to you
Sortable data table with search
Clean, professional design not a generic template
Demo data embedded so you can test before loading your real data
1 revision round included
WHAT KIND OF DATA? ANY.
I've worked with data from all kinds of sectors. Recent examples:
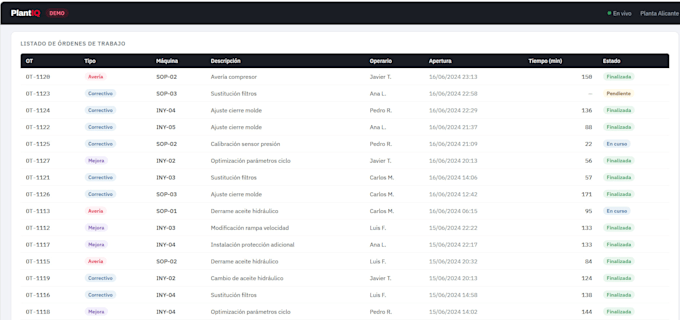
Maintenance work orders from a factory CMMS
Monthly sales by product and region
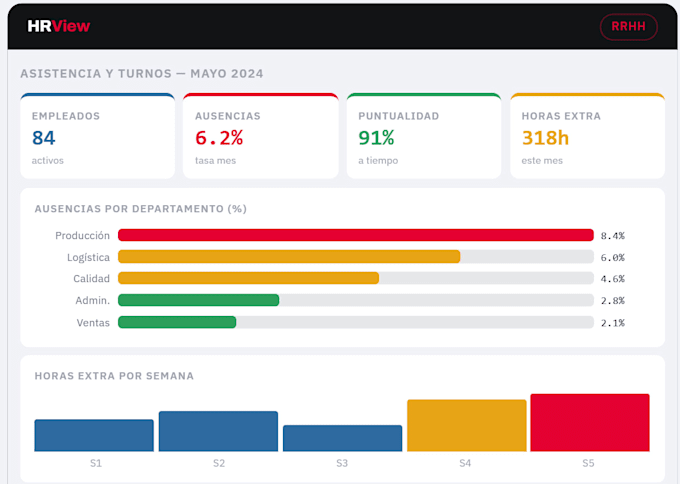
Employee attendance and shift records
Delivery tracking and logistics KPIs
If it's in a spreadsheet or CSV, I can visualise it.
HOW IT WORKS
1. You send me your file (Excel or CSV) + a short note on what you want to see
2. I confirm scope and start building
3. You receive one .html file drag you
Interactive HTML dashboards
Langues
Do I need to install anything to use the dashboard you build?
No. The dashboard is a single .html file. You open it in any web browser (Chrome, Edge, Firefox) — no installation, no license, no internet connection required. It works completely offline.
What file formats do you accept?
CSV and Excel (.xlsx, .xls). If your software exports in a different format, just let me know — in most cases I can work with it or guide you on how to export to CSV.
My data is confidential. Is it safe to send you?
es. You can anonymise or mask sensitive values before sending — I only need the data structure and a sample of real rows to understand the format. All processing in the delivered dashboard happens in your own browser; no data touches any server.
Can I update the data myself once you deliver it?
Yes, that's the whole point. You export a new CSV from your system, drag it onto the HTML file, and your charts update instantly. No technical skills needed. No need to contact me again for routine updates.
Can you deliver the dashboard in Spanish?
Yes. I work in both English and Spanish. Just specify in your requirements.
Can you add our company logo and brand colours?
Yes, included in the Standard and Premium plans. Available as a paid add-on in Basic.