Parcourir les catégories
Français
$
USD
Connectez votre assistant IA à Fiverr

Observability Engineer with expertise in Grafana and Power BI
Compétences
Voir mes services

Observability Engineer
Tata Consultancy Services • Temps plein
Jan 2021 - Present • 5 yrs 10 mos
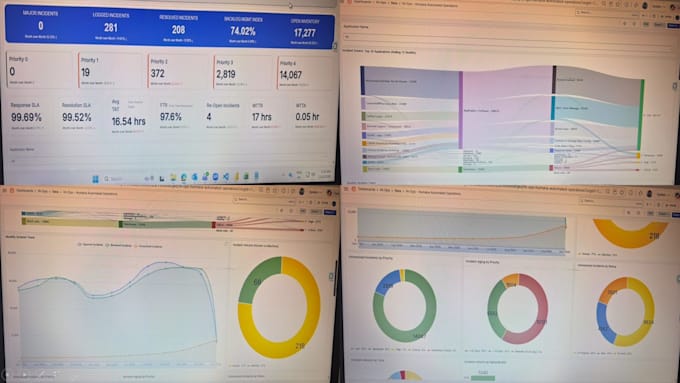
Business Intelligence Developer and Observability Engineer on TCS's SRE and DevOps teams, delivering production-grade dashboards, reports and alerting on Azure and AWS. Power BI • Connected Azure Databricks SQL warehouses to Power BI and cleaned and transformed raw tables using Power Query (M) • Designed star-schema semantic models with optimized relationships for fast, accurate analysis • Built 50+ DAX measures and KPIs, cutting manual reporting effort by 40% • Implemented row-level security (RLS) for role-based report access • Created interactive reports with drill-down, drill-through, slicers and custom Deneb/HTML visuals • Published to Power BI Service and managed refresh schedules and workspace access Grafana • Built dashboards on Azure Managed Grafana (Databricks SQL) and AWS Managed Grafana (Prometheus/PromQL) • Designed variable-driven dashboards with cascading filters and drill-downs from summary to root cause • Delivered advanced visuals: Sankey, heatmap, treemap and bubble charts • Optimized queries and refresh intervals, reducing dashboard load time by 35% • Set up threshold and query-based alerts aligned to SLIs/SLOs, improving MTTR • Automated dashboard and alert deployment using Python, GitLab CI/CD and Azure DevOps Recognition: Best Team Award (2021, 2022) and On The Spot Award at TCS.
