Parcourir les catégories
Explorer
Fiverr Pro
Français
$
USD

Data Analyst Excel Dashboards Pivot Tables and MIS Reporting
Compétences
Voir mes services
Mis Data Analyst
Fintech • Temps plein
Nov 2025 - Present • 8 mos
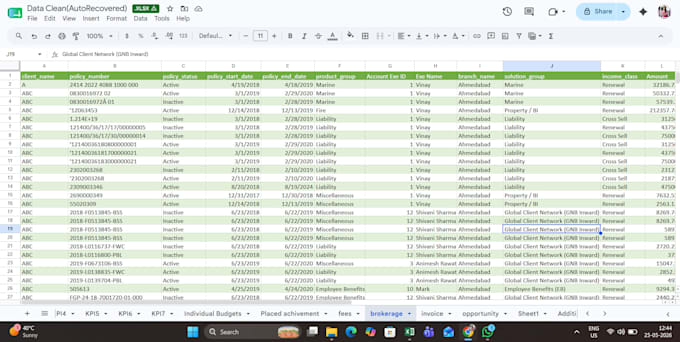
Collected, cleaned, and validated financial datasets (10K–50K+ records), ensuring 100% data accuracy before bank submission Performed data reconciliation of financial transactions, identifying discrepancies and improving reporting reliability. Developed interactive Power BI dashboards to track client financial performance, enabling faster decision making Automated MIS reports using Excel & Google Sheets, reducing manual effort by 30% Used advanced Google Sheets functions (QUERY, IMPORTRANGE, LOOKUP) to consolidate multi-source data Streamlined reporting workflows, improving turnaround time and operational efficiency Managed invoicing and payment tracking, ensuring accurate revenue reporting
Data Analyst
Wisdom Technologies s.r.o. • Temps plein
Mar 2023 - Sep 2025 • 2 yrs 6 mos
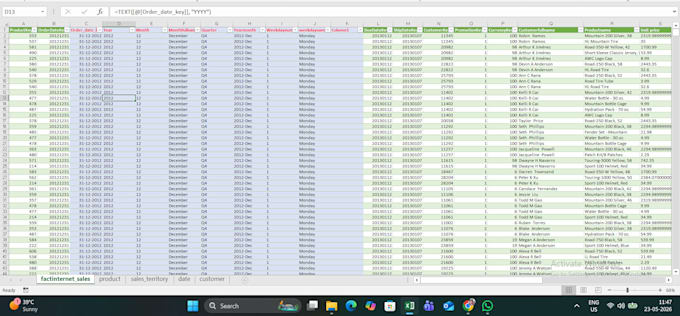
Extracted and analyzed large-scale sales and customer data (50K+ records) using SQL and Excel Cleaned and transformed raw data using Power Query, improving data consistency and accuracy Designed star schema data model (Fact: Sales | Dimensions: Product, Customer, Date, Category) Developed advanced DAX measures: Total Sales, Net Revenue, AOV, Conversion Rate, Repeat Purchase Rate Built interactive Power BI dashboards to track daily, weekly, and monthly performance trends Enabled drill-down and drill-through analysis for SKU-level insights Identified top-performing and slow-moving products, supporting inventory planning Analyzed customer behavior and return trends, improving retention strategies Automated reporting processes, reducing manual effort and improving efficiency
