I will turn your gis and spatial data into an interactive web dashboard

L
luckyy_j
L
luckyy_j
Janitha S.
Certaines informations sont présentées en anglais.

À propos de ce service

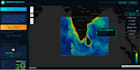
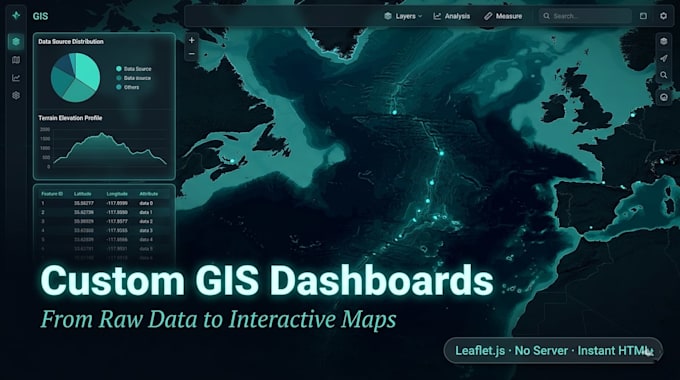
Turn your spatial data into a professional, interactive web dashboard no ArcGIS license, no server, no installation.


I build browser-based GIS dashboards using Leaflet.js that run straight from a single HTML file. Perfect for researchers, survey teams, environmental agencies, and NGOs who need a clean way to visualize and share geospatial data without expensive software.


What you get:

  • An interactive map with your data loaded and styled
  • Layer controls, zoom, and a custom legend
  • A chart or analysis panel alongside the map
  • A clean dark-themed UI built for analysts
  • One self-contained .html file open it anywhere, share it with anyone


Supported data formats:

CSV · GeoJSON · Shapefile (.shp) · More formats available via add-on
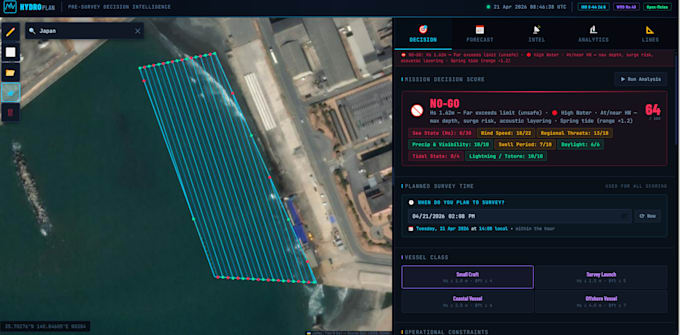

Great for:

Hydrological surveys · Marine & oceanography · Environmental monitoring · Remote sensing · Coastal management · Urban planning


Message me before ordering share your data format and use case and I'll confirm it's a good fit. I reply fast.

Découvrez Janitha S.

Janitha S.

Aspiring GIS and Geospatial Analyst

  • DeSri Lanka
  • Membre depuisoct. 2024
  • Temps de réponse moy.2 heures
  • Langues

    Cinghalais, Anglais
🌐 𝗣𝗿𝗼𝗳𝗲𝘀𝘀𝗶𝗼𝗻𝗮𝗹 𝗚𝗜𝗦 & 𝗚𝗲𝗼𝘀𝗽𝗮𝘁𝗶𝗮𝗹 𝗔𝗻𝗮𝗹𝘆𝘀𝘁 🌍 Welcome! I'm a passionate and versatile digital creator and GIS, Remote Sensing professional with years of experience delivering high-accuracy geospatial solutions worldwide. I specialize in Satellite-Derived Bathymetry and advanced GIS tasks - turning satellite data into clean, publication-ready maps, 3D visualizations, change detection, spectral indices, flood models & Python automation. You get professional GeoTIFFs, interactive results, slides & full Python code - fast, accurate, tailored to you.

Mon portfolio

Balises associées