Parcourir les catégories
Explorer
Fiverr Pro
Français
$
USD

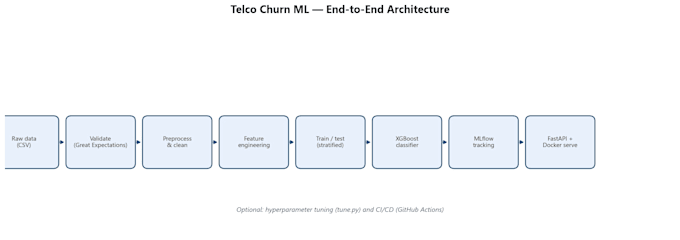
Production Ready ML, MLOps and Analytics Solutions
Compétences
Voir mes services
Data Analytics job simulation
Deloitte Digital
Jul 2025 - Sep 2025 • 2 mos
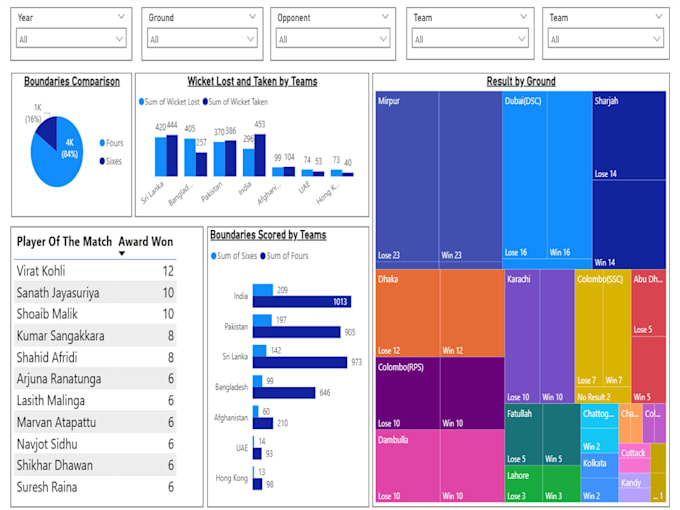
Completed Deloitte’s Data Analytics Job Simulation where I worked on practical business-oriented analytics tasks involving data cleaning, reporting, visualization, and insight generation. The simulation focused on solving real-world business problems using analytical thinking, reporting tools, and data-driven decision-making techniques commonly used in professional analytics environments. Project 1 – Advanced Excel Analytics Worked on data analysis and reporting tasks using advanced Excel functions including LOOKUP functions, Pivot Tables, conditional formulas, data validation, and KPI calculations. The project focused on organizing business datasets, extracting meaningful insights, and creating structured analytical reports for decision-making. Project 2 – SQL Server & Power BI Dashboard Performed data cleaning, transformation, and querying in SQL Server using SQL techniques to prepare raw datasets for analysis. Imported the cleaned data into Power BI and built interactive dashboards with charts, filters, KPIs, and visual reports to help analyze business performance and trends effectively. Project 3 – Tableau Visualization Dashboard Designed and developed interactive Tableau dashboards to visualize business data and present insights in a clear and user-friendly format. Worked on trend analysis, performance tracking, and dashboard storytelling to improve understanding of data and support strategic business decisions.
