I will do the graphical representation of your data

M
mrunastatistics
M
mrunastatistics
Mrunastatistics
Certaines informations sont présentées en anglais.

À propos de ce service

***Kindly contact me before placing your order to discuss what exactly you need.***

Are you facing any challenges in handling your statistical work?

Do you need a detailed visualization of your data?

I will help you in:

  • Preliminary data analysis
  • Descriptive data analysis

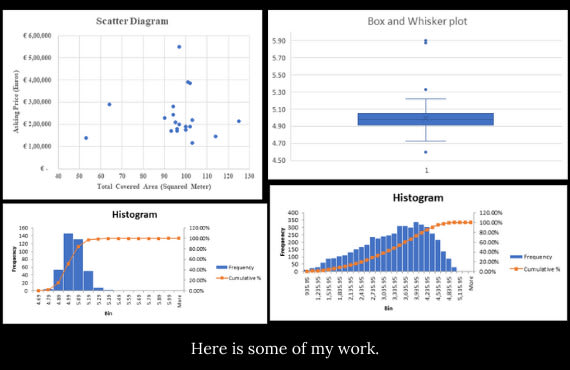
Graphical representation mainly includes:

  • Histogram
  • Bar diagram or bar chart or bar graph
  • Dot plot
  • Frequency polygon
  • Cumulative frequency curve or ogive curve
  • Line graph or stick graph
  • Pie chart
  • Line chart or time plot
  • Stem and leaf plot
  • Box and whisker plot
  • Scatter plot
  • Frequency distribution

And may more.

I will represent your data manually or with the help of R studio or MS Excel or Python programming.

Please check my other gigs to explore more topics.

Thank you.

Découvrez Mrunastatistics

Mrunastatistics

Data Analyst, Excel, Power BI and Statistical Analysis

5,0(72)
  • DeInde
  • Membre depuisaoût 2020
  • Dernière commande1 an
  • Langues

    Anglais, Marathi, Hindi
Hi, I’m Mrunal, a Data Analyst with a postgraduate degree in Statistics, specialising in transforming raw data into clear and actionable insights. I work on data cleaning, exploratory data analysis, Power BI dashboard development, statistical analysis, hypothesis testing, Excel reporting, SQL querying, and academic or research support. I help businesses, students, and professionals make informed decisions through structured analysis and effective data visualisation, with a strong focus on accuracy, clarity, and timely delivery of high-quality results. I look forward to collaborating with you.

Autres services de Data visualisation I Offre