Parcourir les catégories
Explorer
Fiverr Pro
Français
$
USD

Traduction automatique
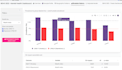
Transformez vos feuilles de calcul en un tableau de bord interactif en direct que votre équipe peut réellement utiliser.
Je crée des tableaux de bord de données en R Shiny (et Python Streamlit/Dash sur demande), le genre où
vous cliquez sur un filtre et tout le graphique se met à jour, pas un PDF statique qui devient obsolète la semaine suivante.
CE QUE VOUS OBTENEZ :
Filtres interactifs, menus déroulants, plages de dates pour explorer vos propres données, sans besoin de coder
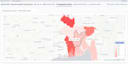
Graphiques, tableaux et cartes KPI dans une interface épurée
Lien hébergé que vous pouvez partager avec votre équipe, ou code source pour le faire vous-même
Basé sur une formation en statistiques pour que les tendances et comparaisons soient précises, pas seulement esthétiques
CAS D'USAGE COURANTS :
- Tableaux de bord de suivi des ventes / revenus
- Explorateurs de données d'enquêtes ou de recherches
- Suivi des opérations et KPI
- Tableaux de bord de données de santé / enquêtes (ma spécialité)
Envoyez-moi vos données et les questions auxquelles vous souhaitez que le tableau de bord réponde
Je le transformerai en quelque chose que vous pourrez parcourir aussi rapidement que possible.
Statistician and Research Data Analyst
Langues
Traduction automatique
Traduction automatique
Dois-je nettoyer mes données avant de vous les envoyer ?
Pas nécessairement ! Bien que disposer de données relativement organisées facilite le travail, je peux gérer le nettoyage, le prétraitement, la gestion des valeurs manquantes et la structuration dans le cadre des packages Standard et Premium.
Vais-je recevoir le code source Python ou R réel ?
Oui, absolument. La transparence est une priorité. Selon l’environnement que nous choisirons, vous recevrez le code source entièrement commenté et propre sous forme de fichier .py, .R, .ipynb (Jupyter Notebook) ou .Rmd (R Markdown) pour que vous ou votre équipe puissiez l’exécuter et le modifier à l’avenir.
Pouvez-vous créer des tableaux de bord qui se mettent à jour automatiquement avec des données en direct ?
Oui ! En utilisant Python (Streamlit/Dash) ou R (Shiny), je peux connecter votre tableau de bord à des flux de données en direct, des API ou des bases de données cloud (comme AWS, Google BigQuery ou PostgreSQL) pour que vos graphiques se rafraîchissent automatiquement lorsque vos données sont mises à jour.
Pourquoi choisir un service Python/R plutôt qu’un service Power BI ou Tableau ?
Les outils BI traditionnels sont excellents, mais ils sont limités par les contraintes logicielles et les frais d’abonnement. Python et R offrent une personnalisation infinie.
Je peux héberger les tableaux de bord interactifs (Streamlit / R Shiny) pour vous ?
Je vais créer, styliser et optimiser entièrement votre application et fournir le code prêt à déployer. Je vous guiderai également dans le processus de configuration d’hébergement gratuit (comme Streamlit Community Cloud ou Shinyapps.io).
Comment gérez-vous la confidentialité des données et la confidentialité d'entreprise ?
La sécurité des données est traitée avec le plus grand sérieux. Vos données professionnelles sont utilisées uniquement pendant la durée du projet pour créer vos visualisations et sont supprimées de mes systèmes locaux une fois le projet terminé. Je suis tout à fait disposé à signer un accord de non-divulgation (NDA).


