Parcourir les catégories
Explorer
Fiverr Pro
Français
$
USD

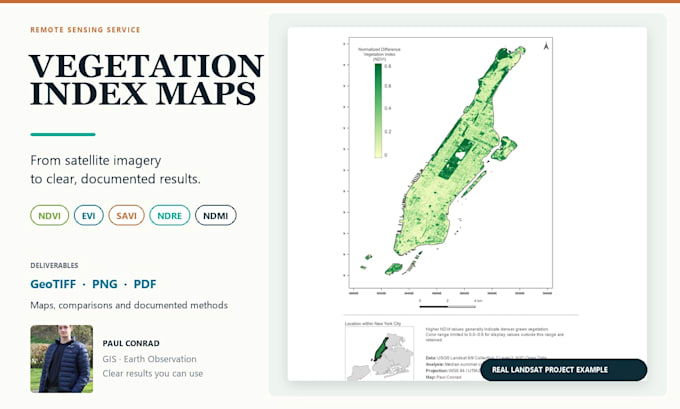
Turn satellite imagery into clear, documented vegetation-index maps you can understand and use.
I calculate and map compatible indices for your study area using supplied imagery or open Sentinel-2/Landsat data, depending on the package.
Options can include NDVI, EVI, SAVI, MSAVI, GNDVI, NDRE, NDMI, or a custom formula when the required bands are available.
Depending on the package, you can receive:
Every project is checked for sensor compatibility, cloud conditions, spatial extent and intended use. Contact me before ordering if you need multiple dates, a large area, commercial imagery, a time series or an unusual index.
Vegetation indices are remotely sensed indicators, not direct measurements of plant health, biomass or yield. I document relevant interpretation limits so the results can be used responsibly.
To get started, send your study-area boundary, preferred dates, intended use and required output format. If you are unsure which index fits your question, I can recommend an appropriate option based on the available imagery.
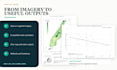
From raw spatial data to results you can understand and use
Langues
Which vegetation indices can you calculate?
Depending on the imagery and your objective, I can calculate indices such as NDVI, EVI, SAVI, MSAVI, GNDVI, NDRE and NDMI. I can also implement a custom formula when the required spectral bands are available.
Do I need to provide the satellite imagery?
For the Basic package, please provide suitable analysis-ready imagery containing the required spectral bands. The Standard and Premium packages include sourcing suitable open Sentinel-2 or Landsat imagery.
Which satellite data can you work with?
I primarily work with Sentinel-2 and Landsat data. Other imagery may also be suitable if you provide it and it contains the required bands, spatial reference and usage rights.
What should I provide before the project begins?
Please provide your study-area boundary, preferred date or date range, intended use, desired index, output format and coordinate reference system if required. GeoJSON, GeoPackage, Shapefile or KML boundaries are suitable.
What if I do not know which index I need?
Describe the question you want to answer and the type of area you are studying. I can recommend a suitable index based on your objective, the available imagery and the required spectral bands.
Can you compare multiple dates or seasons?
Yes. One additional comparison period can be added as an extra. Longer time series, multiple seasons or change-detection projects require a custom offer because processing effort depends on area size, cloud cover and data availability.
What files will I receive?
Depending on the package, deliverables can include georeferenced GeoTIFF rasters, PNG and PDF maps, processing notes, comparison charts and zonal-statistics tables. An organized QGIS project can be added separately.
What happens if suitable cloud-free imagery is unavailable?
I will check data availability before processing. Depending on the project, we can use a wider date range, create a composite or select a different period. I will contact you if the requested imagery cannot support a reliable result.