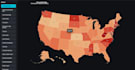
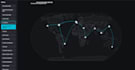
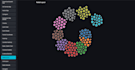
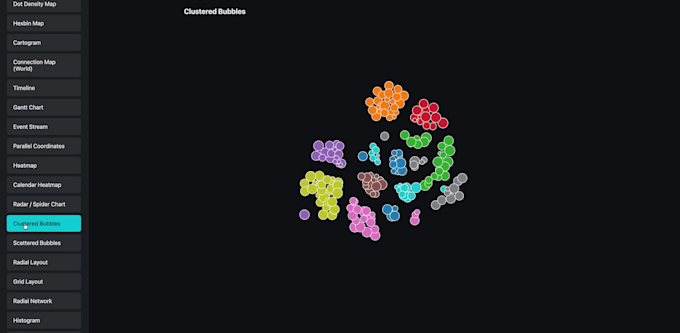
I will do data visualization using d3 graphs, charts and maps

S
sakilcoder
S
sakilcoder
Sakil
Certaines informations sont présentées en anglais.

À propos de ce service

Please contact me before placing an order and share your project requirements so I can recommend the most suitable solution for your needs.


My journey into data visualization began during my work as a physicist, where I developed a strong foundation in analytical thinking and data interpretation. Since then, I have focused on transforming complex datasets into clear, meaningful, and visually compelling insights.


Heres how I can support your project:

  • If you have raw data, I will help you select the most effective chart type to communicate your message clearly.
  • If you have a mockup or design specification, I will implement it precisely using clean and efficient code.
  • If you already have an existing chart, I can redesign and enhance it with improved aesthetics, structure, and interactivity.
  • If you need something uniquewhether a static figure or a fully interactive web visualizationI am happy to discuss and tailor a solution to your goals.


Deliverables can include high-quality static images or complete HTML/CSS/JavaScript files ready for deployment.


I value professional, long-term collaboration and clear communication. Feel free to reach out at any time to discuss your project.

Découvrez Sakil

Sakil

GIS Programming Expert

5,0(62)
  • DeBangladesh
  • Membre depuisjuil. 2020
  • Dernière commande2 années
  • Langues

    Bengali, Anglais
GIS Application Developer specializing in Esri and open-source geospatial technologies. Experienced in ArcGIS Enterprise, Server, Online, Dashboards, Experience Builder, and GeoEvent, along with PostGIS, GeoServer, Leaflet, Mapbox, D3, OpenLayers and React. Skilled in building scalable web GIS apps, real-time dashboards, spatial APIs, and enterprise geodatabase solutions.

Mon portfolio