Parcourir les catégories
Explorer
Fiverr Pro
Français
$
USD


Traduction automatique
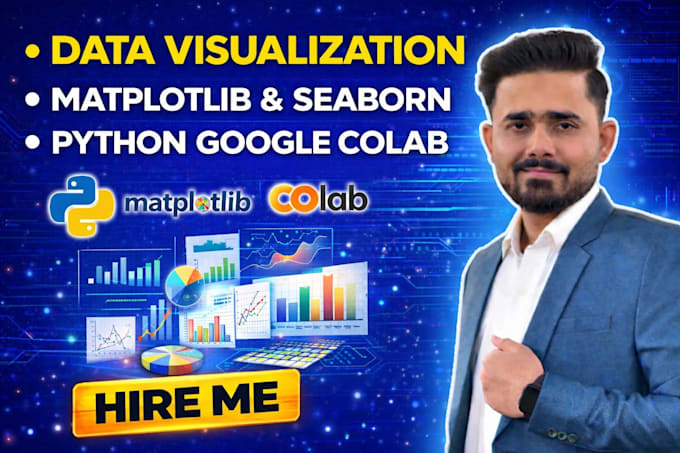
Vous cherchez des visualisations de données propres, professionnelles et perspicaces ? Vous êtes au bon endroit.
Je créerai des visualisations de haute qualité en utilisant Python avec Matplotlib et Seaborn dans Google Colab.
Je transforme des données brutes en visuels clairs et significatifs qui vous aident à comprendre les motifs, tendances et insights.
Ce que je propose
Nettoyage et prétraitement des données
Analyse exploratoire des données (EDA)
Visualisation statistique des données
Graphiques et diagrammes personnalisés
Interprétation approfondie des données
Livraison via Google Colab Notebook
Types de visualisations
Graphiques en ligne
Diagrammes en barres
Histograms
Heatmaps
Nuages de points
Box plots
Pair plots
Outils et technologies
Python
Matplotlib
Seaborn
Pandas
Google Colab
Pourquoi me choisir ?
Visuals propres et professionnels
Insights faciles à comprendre
Livraison rapide
Code bien documenté
Communication claire
Contactez-moi avant de passer commande pour discuter de votre projet. Transformons vos données en insights visuels puissants.
Data Scientist, AI, ML, DL Engineer
Langues
Traduction automatique
Traduction automatique
Vais-je obtenir le code source ?
Oui, vous recevrez un notebook Google Colab complet avec un code propre et bien commenté.
Quel type de données pouvez-vous visualiser ?
Je peux travailler avec CSV, Excel, JSON ou tout autre jeu de données structuré pour la visualisation et l'analyse.
Quels outils utilisez-vous pour la visualisation ?
J'utilise des bibliothèques Python comme Matplotlib et Seaborn dans Google Colab.
Pouvez-vous personnaliser les graphiques ?
Oui, je peux personnaliser entièrement les graphiques selon vos exigences, couleurs et préférences stylistiques.
Fournissez-vous des insights avec les visualisations ?
Oui, je peux inclure des explications claires et des insights pour mieux comprendre vos données.
Dois-je vous contacter avant de commander ?
Oui, il est conseillé de discuter de votre jeu de données et de vos besoins avant de passer commande.
