Parcourir les catégories
Explorer
Fiverr Pro
Français
$
USD
Data Science, régression linéaire, processus stochastique, Pandas, Python, R
https://github.com/shibujaiswal-cmyk/data_viz_dashboard
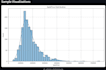
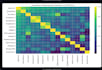
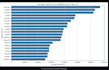
Je suis Shibu Jais, spécialiste en science des données, et je vous aiderai à comprendre vos données grâce à un tableau de bord de visualisation de données professionnel basé sur Python, construit avec Matplotlib, Seaborn, Plotly et Streamlit.
Avec ce service, vous recevrez des insights visuels entièrement personnalisés et un tableau de bord soigné prêt à être présenté à des clients, des partenaires ou à utiliser dans des rapports.
Ce que vous obtiendrez
Pourquoi me choisir
Forfaits

Traduction automatique
Puis-je voir vos travaux précédents ou des exemples de tableaux de bord ?
https://github.com/shibujaiswal-cmyk/data_viz_dashboard


