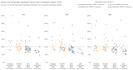
Je vais créer des graphiques simples et avancés avec python, matplotlib et seaborn

T
tanya_lomskaya
T
tanya_lomskaya
Tanya L
Certaines informations ont été traduites automatiquement.

À propos de ce service

Traduction automatique

Je développerai des graphiques simples et avancés avec Matplotlib et Seaborn, prêts à être imprimés en format PDF sur demande.


Votre entrée :

Données dans n'importe quel format (.csv, .xlsx, .json, sql, etc.)


Ma sortie :

Graphiques statiques en formats .png, .jpg, .pdf ;

Notebook Jupyter avec tous les graphiques et codes.


Types de graphiques — tous (nuage de points, histogramme, boîte à moustaches, carte thermique, graphique à barres, graphique en secteurs, diagramme de Gantt, violon, nuage de mots, etc.). Plus de types possibles ici : https://matplotlib.org/3.1.1/gallery/index.html


Découvrez Tanya L

Tanya L

Data Analyst with expertise in Tableau and Python

  • DeGéorgie
  • Membre depuisjuin 2026
  • Langues

    Russe, Anglais
I am a data analyst with a passion for transforming complex data into structured and actionable visual stories. I help with: ⬩ Dashboard design (Tableau, Power BI); ⬩ UX-focused dashboard (re)design; ⬩ Dashboard conversion: Tableau to Power BI and back; ⬩ Exploratory and statistical data analysis (Python, SQL); ⬩ Data extraction, cleaning, and transformation; ⬩ Python visualization (Matplotlib, Seaborn, Plotly). I love working on new projects and finding effective solutions to complex business problems. If this resonates with you, please contact me—I'm always happy to discuss collaboration.

Traduction automatique