Parcourir les catégories
Français
$
USD
Connectez votre assistant IA à Fiverr

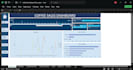
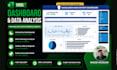
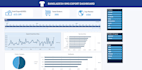
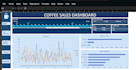
Staring at rows of raw data with no easy way to see what's actually happening in your business? A cluttered spreadsheet doesn't tell a story. A dashboard does.
I'll turn your raw data into a clean, interactive Excel dashboard: KPI summary cards up top, filters and slicers so you can drill into any time period or category, and charts that actually show the trend instead of burying it in rows.
What you get:
- KPI cards for your key numbers (totals, top performer, headline metric)
- Interactive slicers/filters (date range, category, region, whatever fits your data)
- 2-4 charts matched to what the data actually needs to show
- Clean, professional layout, not a default Excel chart dumped on a sheet
- Delivered as a ready-to-use .xlsx file
Why work with me:
I build the full pipeline, not just the charts, taking raw, messy data through cleaning and structuring before the dashboard stage, so what you get is accurate, not just good-looking.
How it works:
1. Send your data and the metrics that matter to you
2. I clean it, structure it, and build the dashboard
3. You review, and I adjust until it fits
Send your file and I'm happy to confirm scope before you order.
Excel Data Cleaning and Dashboard Specialist
Langues
What file formats do you accept?
.xlsx, .xls or .csv
What do you need from me to start the project?
I need your Excel/CSV data file, your requirements, and any specific KPIs, charts, or design preferences you want.
Is my data kept private?
Yes. Your file is used only to complete your order and isn't shared or reused.


