Parcourir les catégories
Explorer
Fiverr Pro
Français
$
USD

Power BI Power BI Desktop, Service, Power Query, DAX Data SQL, data warehousing,
Compétences
Voir mes services
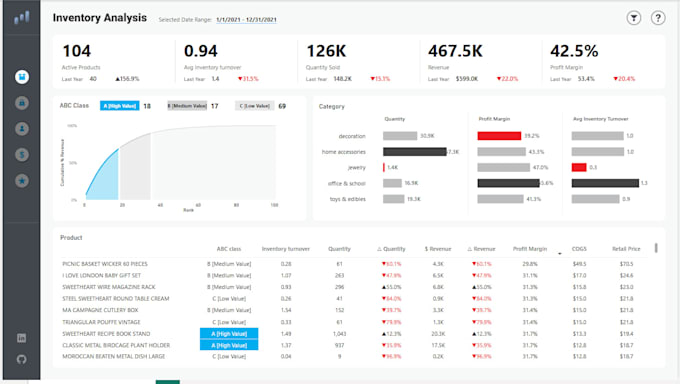
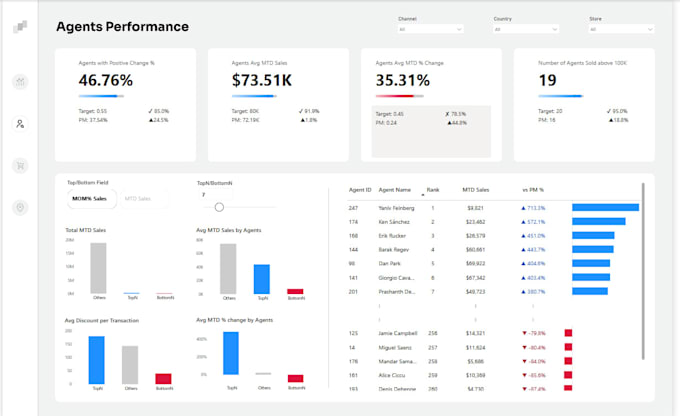

POWER BI DEVLOPER
Barclays • Temps plein
Jul 2020 - Dec 2025 • 5 yrs 5 mos
A Power BI developer turns raw business data into reports and dashboards that help people make decisions. They work across the whole BI lifecycle, from gathering requirements to maintaining reports in production. Core responsibilities 1. Requirement gathering Meet with business users and stakeholders to understand KPIs, questions and reporting needs Convert business requirements into technical specifications Define the scope, metrics and refresh frequency for each report 2. Data connection and extraction Connect to sources such as SQL Server, Excel, SharePoint, Azure, APIs, Google Analytics and cloud databases Choose between Import, DirectQuery and Live Connection modes Set up gateways for on-premises data 3. Data transformation (ETL) Clean, shape and merge data using Power Query (M language) Handle missing values, duplicates, data types and errors Build reusable queries and dataflows 4. Data modeling Design star schemas with fact and dimension tables Create relationships, hierarchies and calculated columns Optimize the model for performance and low memory use 5. DAX calculations Write measures for KPIs such as total sales, YoY growth, running totals, ranking and customer retention Use time intelligence, filter context and variables Build calculation groups where needed 6. Report and dashboard design Build clear, interactive visuals (charts, matrices, maps, slicers, drill-throughs, bookmarks) Apply good design: consistent layout, color, branding and readability Make reports work on desktop and mobile 7. Security Implement Row-Level Security (RLS) and Object-Level Security so users see only the data they are allowed to see Manage workspace access and permissions 8. Publishing and deployment Publish reports to Power BI Service Create workspaces and apps, and manage deployment pipelines (Dev, Test, Prod) Schedule data refreshes and set up alerts and subscriptions 9. Performance optimization Tune slow DAX, reduce model size and use aggregations Use to

E COMMERCE EXECUTIVE
Iksula • Temps plein
Jun 2018 - Aug 2019 • 1 yr 2 mos
. Revenue and sales trend Question: Are we growing, and when do customers buy? Revenue, orders and average order value (AOV) by month What to look for: seasonality (festive peaks, sale events), dips, and whether growth is driven by more orders or bigger baskets. Story line: "Sales peaked in [month] during [campaign], but fell [X%] afterwards, so a lot of demand was pulled forward by discounts."
